Datei:Climate Change Attribution.png
Beschreibung
| Beschreibung |
English: See extending Description below |
| Quelle | This figure was created by Robert A. Rohde from published data |
| Urheber | Robert A. Rohde |
| Andere Versionen |
[]
|


|
Dieses Bild des Typs Graph sollte als Vektorgrafik im SVG-Format neu erstellt werden. Vektorformate haben zahlreiche Vorteile; weitere Information unter Commons:Media for cleanup. Wenn dir eine SVG-Version dieses Bildes vorliegt, so lade diese bitte hoch. Nach dem Hochladen der Datei ist diese Vorlage auf der aktuellen Bildbeschreibungsseite durch die Vorlage {{Vector version available}}, oder kürzer {{Vva}}, zu ersetzen. Es ist empfohlen die neue SVG-Datei „Climate Change Attribution.svg“ zu nennen – dann benötigt die Vorlage vector version available (bzw. vva) keinen Parameter.
|
Beschreibung

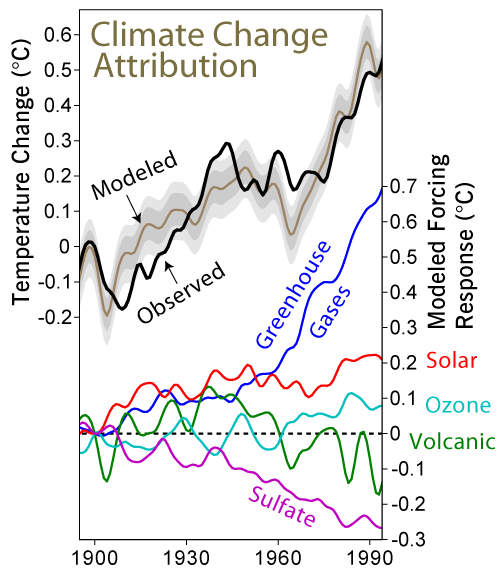
This figure, based on Meehl et al. (2004), shows how a global climate model (the DOE PCM [1]) is tuned to reconstruct the historical temperature record and the corresponding assumptions in the model to which the associated temperature changes can be decomposed into various forcing factors. The top part of the figure compares a five year average of global temperature measurements (Jones and Moberg 2001) to the Meehl et al. results incorporating the effects of five predetermined forcing factors: greenhouse gases, man-made sulfate emissions, solar variability, ozone changes (both stratospheric and tropospheric), and volcanic emissions (including natural sulfates). The time history and radiative forcing qualities for each of these factors was specified in advance and was not adjusted indvidually to specifically match the temperature record. The exception being the aerosol forcing which is based on expert´s judgement balancing the GHG forcing due to the inherent large uncertainty of the historical aerosol forcings.
Also shown are grey bands indicating the 68% and 95% range for natural variability in temperature relative to the climatic expectation as determined from multiple simulations with different initial conditions. In other words, they indicate the estimated size of variations that are expected to occur due to fluctuation in weather rather than changes in climate. Ideally the model should be able to reconstruct temperature variations to within about the tolerance specified by these bands. Some of the remaining misfit may be accounted for by the ~0.05 °C uncertainty in the temperature reconstruction. However, though the model captures the gross features of twentieth century climate change, it remains likely that some of the differences between model and observation still reflect the limitations of the model and/or our understanding of the histories of the observed forcing factors.
In the lower portion of the figure are the results of additional simulations in which the model was operated with only one forcing factor used at a time. A key conclusion of the Meehl et al. (2004) work is that the model response to all factors combined is to a good approximation equal to the sum of the responses to each factor taken individually. This means it is reasonable to talk about the temperature change due to individual aspects of the evolving man-made and natural influences on climate. The zeros on both plots are set equal to 1900 temperatures, and it is apparent that most of the 0.52 °C global warming between 1900 and 1994 should be attributed to a 0.69 °C temperature forcing from greenhouse gases partially offset by a 0.27 °C cooling due to man-made sulfate emissions and with other factors contributing the balance. This contrasts with the warming from 1900 to 1940 for which the model only attributes a net increases of 0.06 °C to the combined effects of greenhouse gases and sulfate emissions.
| Temperature change relative to 1900 | |||
|---|---|---|---|
| 1940 | 1970 | 1994 | |
| Greenhouse gases | 0.10 | 0.38 | 0.69 |
| Sulfate emissions | -0.04 | -0.19 | -0.27 |
| Solar forcing | 0.18 | 0.10 | 0.21 |
| Volcanic forcing | 0.11 | -0.04 | -0.14 |
| Ozone | -0.06 | 0.05 | 0.08 |
| Net | 0.19 | 0.17 | 0.53 |
| Observed | 0.26 | 0.21 | 0.52 |
Note that "Net" reflects the model runs with all factors included and is not identical to simply summing the individual factors.
References
- Meehl, Gerald A.; Washington, Warren M.; Ammann, Caspar M.; Arblaster, Julie M.; Wigley, T. M. L.; Tebaldi, Claudia (2004). "Combinations of Natural and Anthropogenic Forcings in Twentieth-Century Climate". Journal of Climate 17: 3721–7. DOI:10.1175/1520-0442(2004)017%3C3721:CONAAF%3E2.0.CO;2. ISSN 1520-0442.
- Jones, P. D.; Moberg, A. (2003). "Hemispheric and Large-Scale Surface Air Temperature Variations: an Extensive Revision and an Update to 2001". Journal of Climate 16: 206–23. DOI:10.1175/1520-0442(2003)016%3C0206:HALSSA%3E2.0.CO;2. ISSN 1520-0442.
Lizenz
This figure was created by Robert A. Rohde from published data and is incorporated into the Global Warming Art project.

|
Es ist erlaubt, die Datei unter den Bedingungen der GNU-Lizenz für freie Dokumentation, Version 1.2 oder einer späteren Version, veröffentlicht von der Free Software Foundation, zu kopieren, zu verbreiten und/oder zu modifizieren; es gibt keine unveränderlichen Abschnitte, keinen vorderen und keinen hinteren Umschlagtext.
Der vollständige Text der Lizenz ist im Kapitel GNU-Lizenz für freie Dokumentation verfügbar. |
  
|
Diese Datei ist unter der Creative-Commons-Lizenz „Namensnennung – Weitergabe unter gleichen Bedingungen 3.0 nicht portiert“ lizenziert. | |
| ||
| Diese Lizenzmarkierung wurde auf Grund der GFDL-Lizenzaktualisierung hinzugefügt. |
|
|
Dieses Bild des Typs Graph sollte als Vektorgrafik im SVG-Format neu erstellt werden. Vektorformate haben zahlreiche Vorteile; weitere Information unter Commons:Media for cleanup. Wenn dir eine SVG-Version dieses Bildes vorliegt, so lade diese bitte hoch. Nach dem Hochladen der Datei ist diese Vorlage auf der aktuellen Bildbeschreibungsseite durch die Vorlage {{Vector version available}}, oder kürzer {{Vva}}, zu ersetzen. Es ist empfohlen die neue SVG-Datei „Climate Change Attribution.svg“ zu nennen – dann benötigt die Vorlage vector version available (bzw. vva) keinen Parameter.
|
Dateiversionen
Klicke auf einen Zeitpunkt, um diese Version zu laden.
| Version vom | Vorschaubild | Maße | Benutzer | Kommentar | |
|---|---|---|---|---|---|
| aktuell | 19:08, 16. Jul. 2014 | | 500 × 573 (28 KB) | wikimediacommons>JeffyP | Shrinkin' the image. |
Dateiverwendung
Die folgende Seite verwendet diese Datei:
